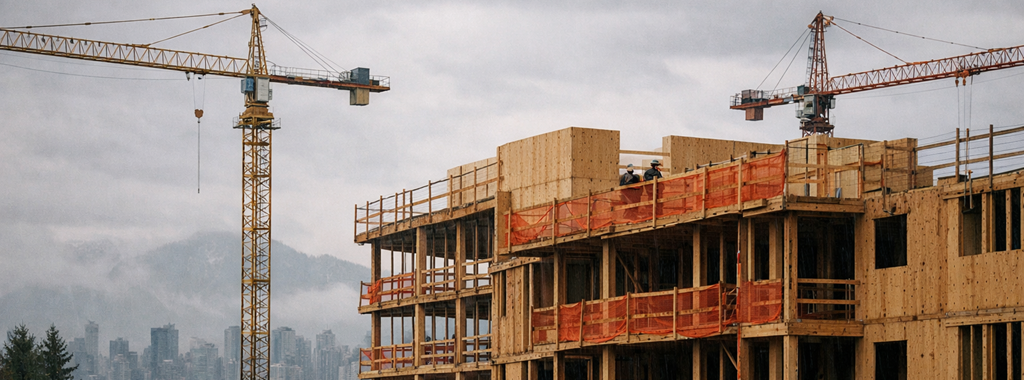
The National Building Code of Canada (NBCC) 2020 was recently changed, prompting new design requirements for multilevel wood construction. This article will provide a high-level comparison between ATS rod systems and holdowns, offering insight into which method is best depending on environmental factors and cost of installation.
Tag: seismic design
From Research to Real-World Application: Pioneering Mass Timber Innovation
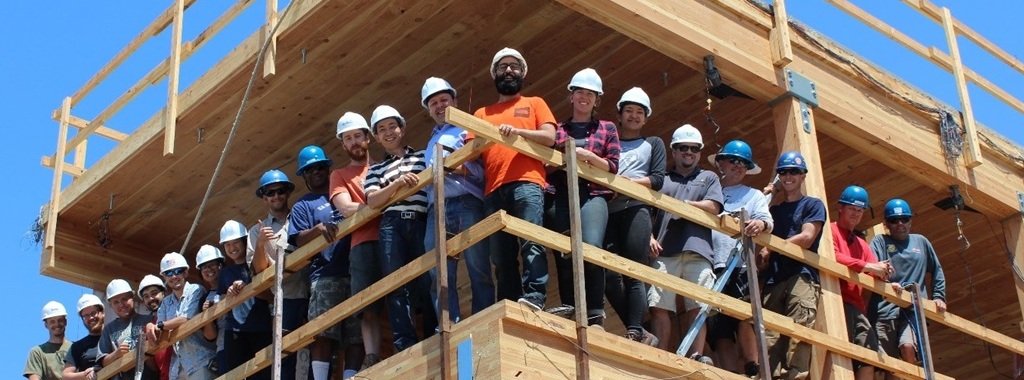
Brian DeMeza’s journey from pursuing his Master of Science degree at Oregon State University (OSU) to his current role as a Senior Field Engineer at Simpson Strong-Tie has brought him full circle with his recent involvement in the six-story NHERI TallWood project. His hands-on experience in this project played a pivotal role in shaping his passion and focus on mass timber as a potential career path.
Code Update: Revisions Finalized for the 2018 IRC
This blog post continues our series on the final results of the 2016 ICC Group B Code Change Hearings. This post will focus on approved changes to the International Residential Code (IRC) that are of a structural nature. The changes outlined here will be contained in the 2018 IRC, which is expected to be published in the fall of this year.
In Chapter 3, the seismic design category / short-period design spectral response acceleration maps will be updated to match the new USGS/NEHRP Seismic Maps. These new maps are based on the worst case assumption for Site Class. Significantly, a new set of maps will be provided in Figure 301.2(3) “Alternate Seismic Design Categories”. These are permitted to be used when the “soil conditions are determined by the building official to be Site Class A, B or D.” See page 29 of the linked document for the new maps and a good explanation of the changes that will be occurring in various parts of the country. In addition, the ICC Building Code Action Committee authored a reorganization of the seismic provisions of Chapter 3 to try to reduce confusion.
Another change in Chapter 3 will clarify that guards are only required on those portions of walking surfaces that are located more than 30 inches above grade, not along the entire surface. To bring consistency with the IBC, another change will require that staples in treated wood be made of stainless steel.
A broad group of parties interested in deck safety, known as the Deck Code Coalition, submitted 17 different code changes with revisions to Section R507 on decks. Of those, 12 were approved, making significant changes to that section. The various approved changes included the following: a complete re-write of that section; new/clarified requirements for deck materials, including wood, fasteners and connectors; clarified requirements for vertical and lateral connections of the deck to the supporting structure; new requirements for sizes of deck footings and specification that deck footings must extend below the frost line, with certain exceptions; clarification for deck board material, including an allowance for alternative decking materials and fastening methods; adding new columns to the deck joist span table that show the maximum cantilever for joists; adding the allowance for 8×8 deck posts, to allow notching for the support of a three-ply beam; and clarification of the deck-post-to-footing connection.
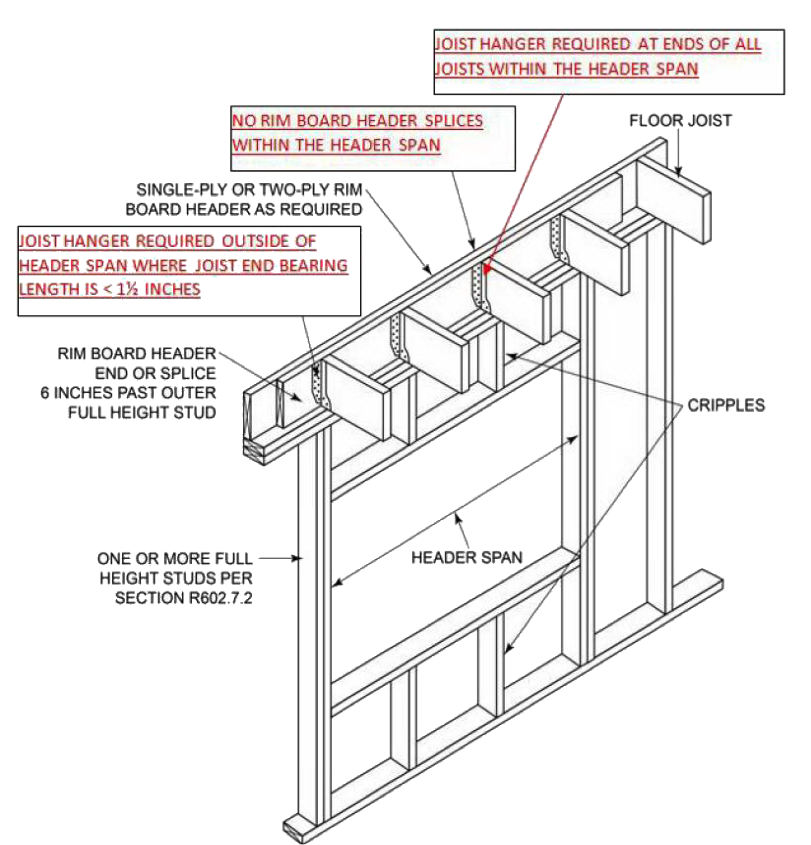
In Chapter 6, a new table permitting 11ʹ- and 12ʹ- long studs was added. In the 2015 IRC, load-bearing studs were limited to 10 feet in length. A new high-capacity nail, the RSRS (Roof Sheathing Ring Shank) nail was added as an option for fastening roof sheathing. This nail will become more widely used once the higher roof component and cladding forces from ASCE 7-16 are adopted. The rim board header detail that was added for the 2015 IRC was corrected to show that hangers are required in all cases when the joists occur over the wall opening.
 There were several changes made to the Wall Bracing Section, R602.10. The use of the 2.0 increase factor was clarified for use when the horizontal joints in braced wall panel sheathing are not blocked. Narrow methods were added to the column headings for the wind and seismic bracing amount tables, to make them consistent, and the methods for adding different bracing were clarified. When using bracing method PFH, the builder can omit the nailing of the sheathing to the framing behind the strap-type holdown. Finally, offering some relief for high-seismic areas where brick veneer is used, an allowance was added to permit a limited amount of brick veneer to be present on the second floor without triggering the use of the BV-WSP bracing method.
In Chapter 8, the requirements for a “stick-framed” roof system were completely re-written to make such systems easier to use.
A couple of significant changes were made to the prescriptive requirements for cold-formed steel framing. The requirements for the anchorage of cold-formed steel walls were revised, and the wind requirements for cold-formed steel framing were changed to match the new AISI S230 prescriptive standard.
Finally, it may be helpful to mention some of the proposed changes that were not adopted. While the new ASCE 7-16 was adopted as the IRC reference standard for loads as part of the Administrative changes, several changes to the IRC to make it consistent with ASCE 7-16 were not approved. A change to update the IRC wind speed maps, roof component and cladding pressures, component and cladding roof zones, and revise the remainder of wind-based requirements to match ASCE 7-16 was not approved. Similarly, a proposal to increase the live load on decks, from 1.0 to 1.5 times the occupancy served, was denied.
Once the IRC is published, it will be time to start a new code change cycle once again, with Group A code changes due January 8, 2018. The schedule for the next cycle is already posted here.
What changes would you like to see for the 2021 codes?
Temblor Insights: Is the San Andreas “locked, loaded, and ready to go?”
Editor’s Note: This is a republished blog post with an introduction by Jeff Ellis.
This is definitely an attention-grabbing headline! At the National Earthquake Conference in Long Beach on May 4, 2016, Dr. Thomas Jordan of the Southern California Earthquake Center gave a talk which ended with a summary statement that the San Andreas Fault is “locked, loaded and ready to go.”
The LA Times and other publications have followed up with articles based on that statement. Temblor is a mobile-friendly web app recently developed to inform homeowners of the likelihood of seismic shaking and damage based on their location and home construction. The app’s creators also offer a blog that provides insights into earthquakes and have writtene a post titled “Is the San Andreas ‘locked, loaded, and ready to go’?” This blog post delves a bit deeper to ascertain whether the San Andreas may indeed be poised for the “next great quake” and is certainly a compelling read. Drop, cover and hold on!
Volkan and I presented and exhibited Temblor at the National Earthquake Conference in Long Beach last week. Prof. Thomas Jordan, USC University Professor, William M. Keck Foundation Chair in Geological Sciences, and Director of the Southern California Earthquake Center (SCEC), gave the keynote address. Tom has not only led SCEC through fifteen years of sustained growth and achievement, but he’s also launched countless initiatives critical to earthquake science, such as the Uniform California Earthquake Rupture Forecasts (UCERF), and the international Collaboratory for Scientific Earthquake Predictability (CSEP), a rigorous independent protocol for testing earthquake forecasts and prediction hypotheses.
In his speech, Tom argued that to understand the full range and likelihood of future earthquakes and their associated shaking, we must make thousands if not millions of 3D simulations. To do this we need to use the next generation of super-computers—because the current generation is too slow! The shaking can be dramatically amplified in sedimentary basins and when seismic waves bounce off deep layers, features absent or muted in current methods. This matters, because these probabilistic hazard assessments form the basis for building construction codes, mandatory retrofit ordinances, and quake insurance premiums. The recent Uniform California Earthquake Rupture Forecast Ver. 3 (Field et al., 2014) makes some strides in this direction. And coming on strong are earthquake simulators such as RSQsim (Dieterich and Richards-Dinger, 2010) that generate thousands of ruptures from a set of physical laws rather than assumed slip and rupture propagation. Equally important are CyberShake models (Graves et al., 2011) of individual scenario earthquakes with realistic basins and layers.
But what really caught the attention of the media—and the public—was just one slide
Tom closed by making the argument that the San Andreas is, in his words, “locked, loaded, and ready to go.” That got our attention. And he made this case by showing one slide. Here it is, photographed by the LA Times and included in a Times article by Rong-Gong Lin II that quickly went viral.
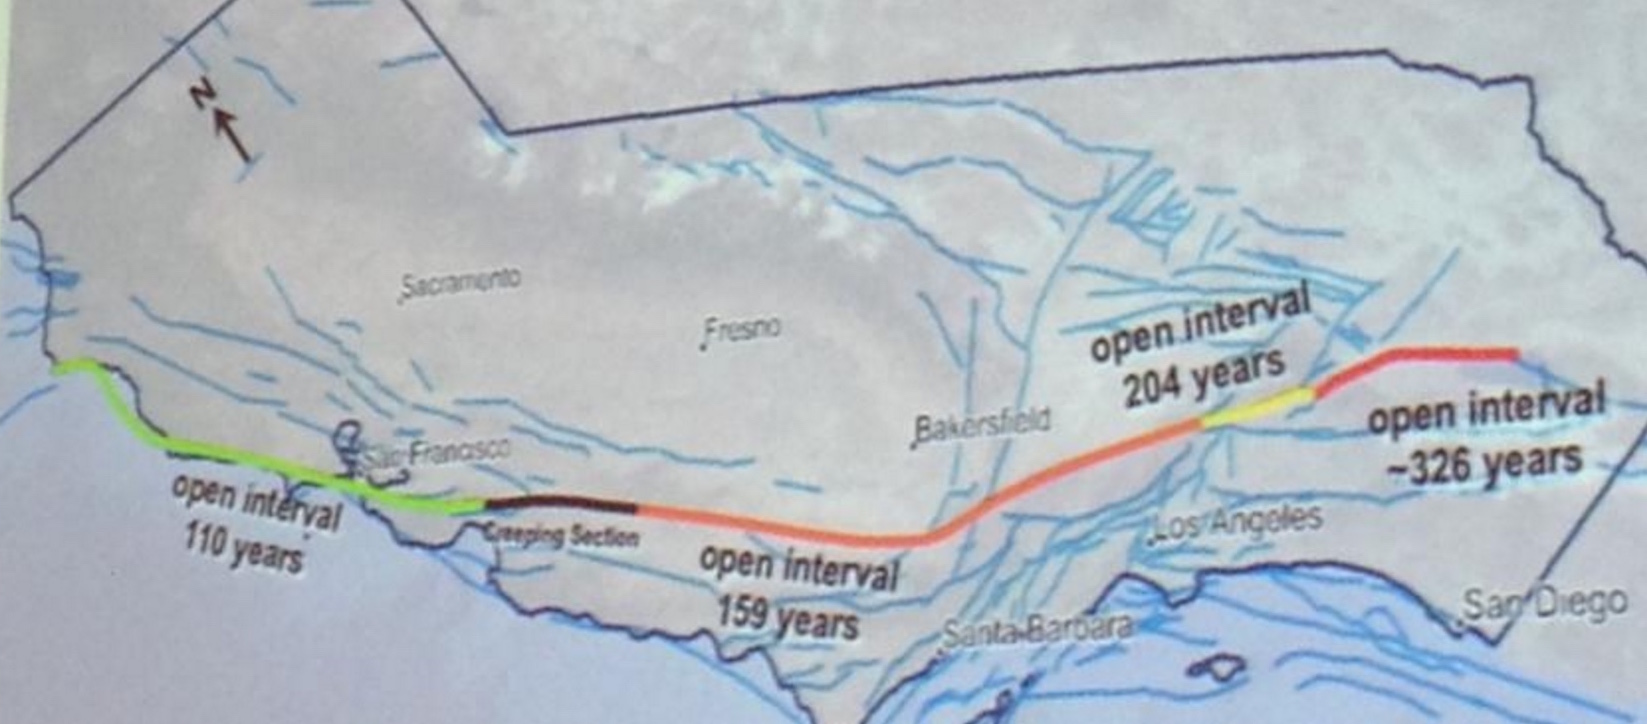
Believe it or not, Tom was not suggesting there is a gun pointed at our heads. ’Locked’ in seismic parlance means a fault is not freely slipping; ‘loaded’ means that sufficient stress has been reached to overcome the friction that keeps it locked. Tom argued that the San Andreas system accommodates 50 mm/yr (2 in/yr) of plate motion, and so with about 5 m (16 ft) of average slip in great quakes, the fault should produce about one such event a century. Despite that, the time since the last great quake (“open intervals” in the slide) along the 1,000 km-long (600 mi) fault are all longer, and one is three times longer. This is what he means by “ready to go.” Of course, a Mw=7.7 San Andreas event did strike a little over a century ago in 1906, but Tom seemed to be arguing that we should get one quake per century along every section, or at least on the San Andreas.
Could it be this simple?
Now, if things were so obvious, we wouldn’t need supercomputers to forecast quakes. In a sense, Tom’s wake-up call contradicted—or at least short-circuited—the case he so eloquently made in the body of his talk for building a vast inventory of plausible quakes in order to divine the future. But putting that aside, is he right about the San Andreas being ready to go?
Because many misaligned, discontinuous, and bent faults accommodate the broad North America-Pacific plate boundary, the slip rate of the San Andreas is generally about half of the plate rate. Where the San Andreas is isolated and parallel to the plate motion, its slip rate is about 2/3 the plate rate, or 34 mm/yr, but where there are nearby parallel faults, such as the Hayward fault in the Bay Area or the San Jacinto in SoCal, its rate drops to about 1/3 the plate rate, or 17 mm/yr. This means that the time needed to store enough stress to trigger the next quake should not—and perhaps cannot—be uniform. So, here’s how things look to me:
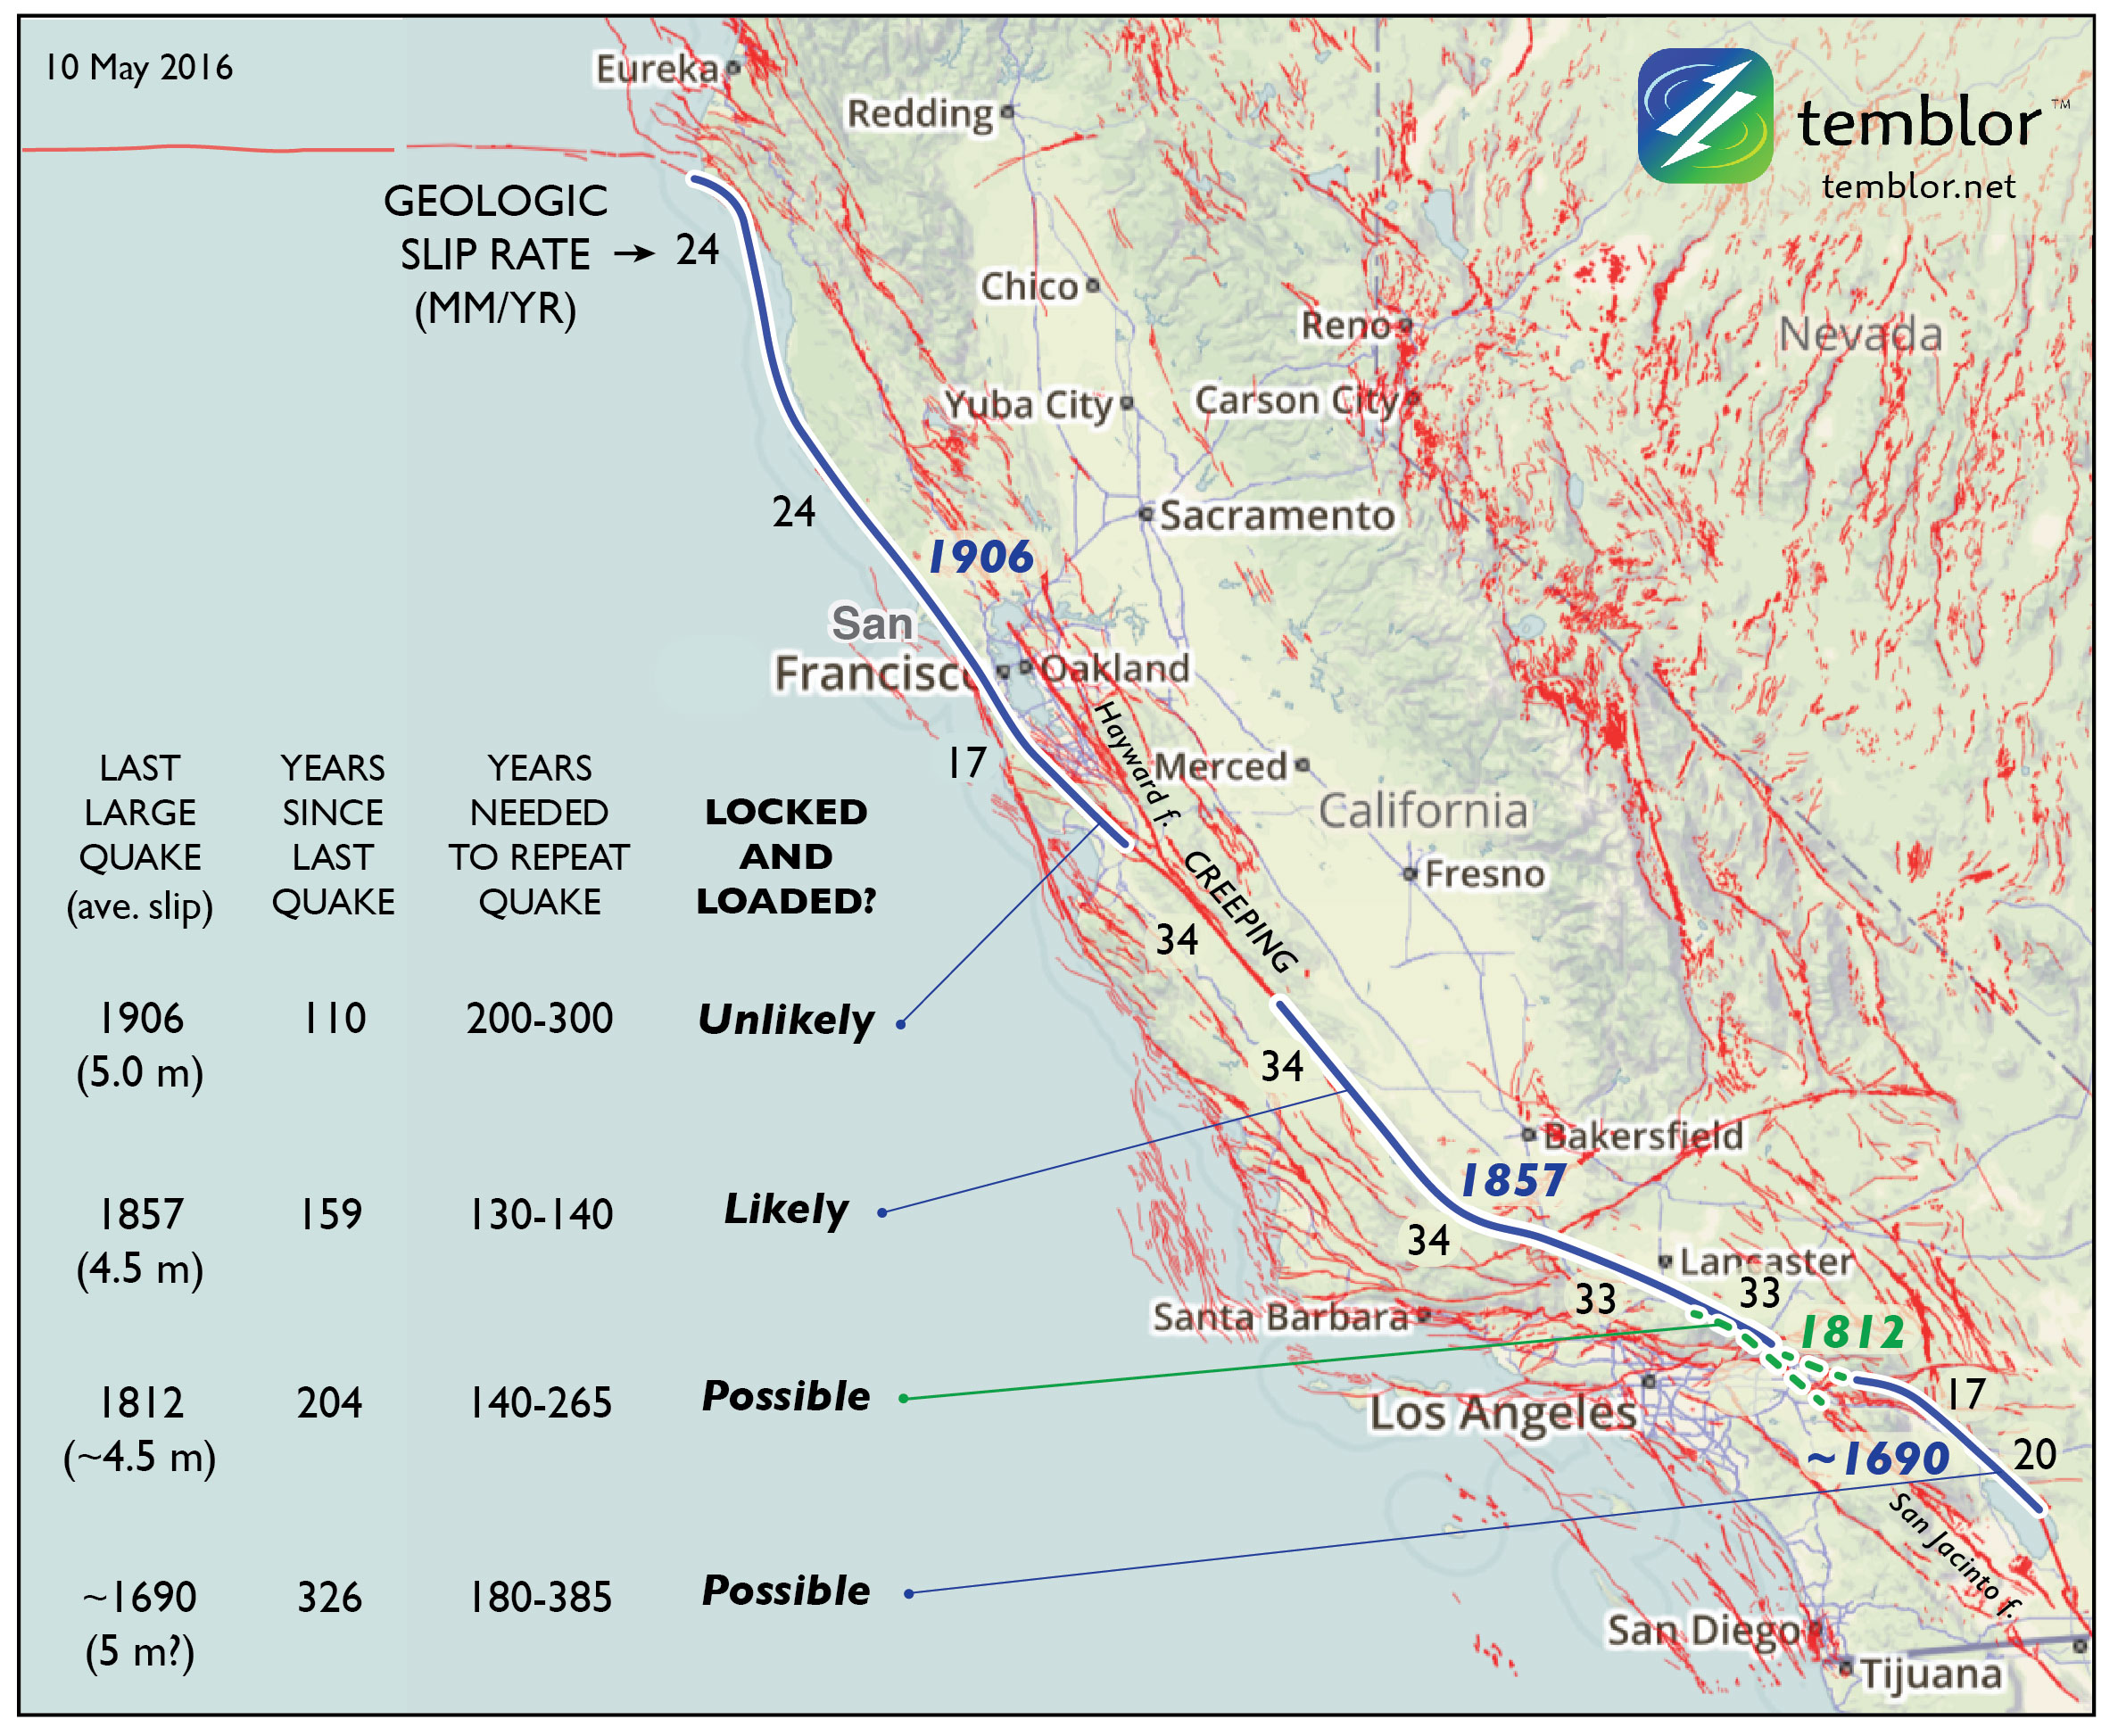
So, how about ‘locked, generally loaded, with some sections perhaps ready to go’
When I repeat Tom’s assessment in the accompanying map and table, I get a more nuanced answer. Even though the time since the last great quake along the southernmost San Andreas is longest, the slip rate there is lowest, and so this section may or may not have accumulated sufficient stress to rupture. And if it were ready to go, why didn’t it rupture in 2010, when the surface waves of the Mw=7.2 El Major-Cucapah quake just across the Mexican border enveloped and jostled that section? The strongest case can be made for a large quake overlapping the site of the Great 1857 Mw=7.8 Ft. Teton quake, largely because of the uniformly high San Andreas slip rate there. But this section undergoes a 40° bend (near the ‘1857’ in the map), which means that the stresses cannot be everywhere optimally aligned for failure: it is “locked” not just by friction but by geometry.
A reality check from Turkey
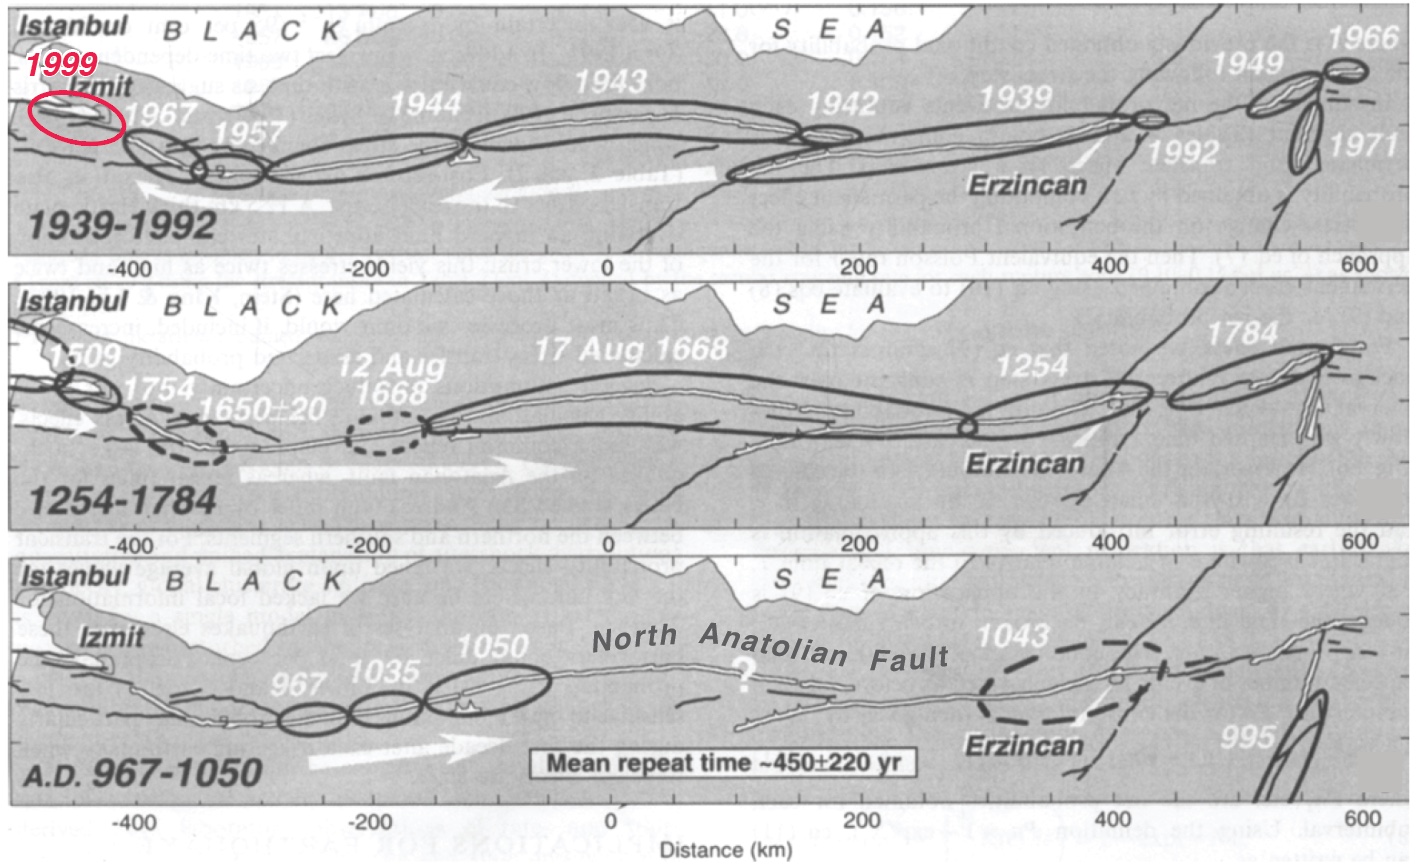
Sometimes simplicity is a tantalizing mirage, so it’s useful to look at the San Andreas’ twin sister in Turkey: the North Anatolian fault. Both right-lateral faults have about the same slip rate, length, straightness, and range of quake sizes; they both even have a creeping section near their midpoint. But the masterful work of Nicolas Ambraseys, who devoured contemporary historical accounts along the spice and trade routes of Anatolia to glean the record of great quakes (Nick could read 14 languages!) affords us a much longer look than we have of the San Andreas.
The idea that the duration of the open interval can foretell what will happen next loses its luster on the North Anatolian fault because it’s inter-event times, as well as the quake sizes and locations, are so variable. If this 50% variability applied to the San Andreas, no sections could be fairly described as ‘overdue’ today. Tom did not use this term, but others have. We should, then, reserve ‘overdue’ for an open interval more than twice the expected inter-event time.
However, another San Andreas look-alike, the Alpine Fault in New Zealand, has a record of more regular earthquakes, with an inter-event variability of 33% for the past 24 prehistoric quakes (Berryman et al., 2012). But the Alpine fault is straighter and more isolated than the San Andreas and North Anatolian faults, and so earthquakes on adjacent faults do not add or subtract stress from it. And even though the 31 mm/yr slip rate on the southern Alpine Fault is similar to the San Andreas, the mean inter-event time on the Alpine is longer than any of the San Andreas’ open intervals: 330 years. So, while it’s fascinating that there is a ‘metronome fault’ out there, the Alpine is probably not a good guidepost for the San Andreas.
If Tom’s slide is too simple, and mine is too equivocal, what’s the right answer?
I believe the best available answer is furnished by the latest California rupture model, UCERF3. Rather than looking only at the four San Andreas events, the team created hundreds of thousands of physically plausible ruptures on all 2,000 or so known faults. They found that the mean time between Mw≥7.7 shocks in California is about 106 years (they report an annual frequency of 9.4 x 10^-3 in Table 13 of Field et al., 2014; Mw=7.7 is about the size of the 1906 quake; 1857 was probably a Mw=7.8, and 1812 was probably Mw=7.5). In fact, this 106-year interval might even be the origin of Tom’s ‘once per century’ expectation since he is a UCERF3 author.
But these large events need not strike on the San Andreas, let alone on specific San Andreas sections, and there are a dozen faults capable of firing off quakes of this size in the state. While the probability is higher on the San Andreas than off, in 1872 we had a Mw=7.5-7.7 on the Owen’s Valley fault (Beanland and Clark, 1994). In the 200 years of historic records, the state has experienced up to three Mw≥7.7 events, in southern (1857) and eastern (1872), and northern (1906) California. This rate is consistent with, or perhaps even a little higher than, the long-term model average.
So, what’s the message
While the southern San Andreas is a likely candidate for the next great quake, ‘overdue’ would be over-reach, and there are many other fault sections that could rupture. But since the mean time between Mw≥7.7 California shocks is about 106 years, and we are 110 years downstream from the last one, we should all be prepared—even if we cannot be forewarned.
Ross Stein (ross@temblor.net), Temblor
You can check your home’s seismic risk at Temblor
References cited:
Sarah Beanland and Malcolm M. Clark (1994), The Owens Valley fault zone, eastern California, and surface faulting associated with the 1872 earthquake, U.S. Geol. Surv. Bulletin 1982, 29 p.
Kelvin R. Berryman, Ursula A. Cochran, Kate J. Clark, Glenn P. Biasi, Robert M. Langridge, Pilar Villamor (2012), Major Earthquakes Occur Regularly on an Isolated Plate Boundary Fault, Science, 336, 1690-1693, DOI: 10.1126/science.1218959
James H. Dietrich and Keith Richards-Dinger (2010), Earthquake recurrence in simulated fault systems, Pure Appl. Geophysics, 167, 1087-1104, DOI: 10.1007/s00024-010-0094-0.
Edward H. (Ned) Field, R. J. Arrowsmith, G. P. Biasi, P. Bird, T. E. Dawson, K. R., Felzer, D. D. Jackson, J. M. Johnson, T. H. Jordan, C. Madden, et al.(2014). Uniform California earthquake rupture forecast, version 3 (UCERF3)—The time-independent model, Bull. Seismol. Soc. Am. 104, 1122–1180, doi: 10.1785/0120130164.
Robert Graves, Thomas H. Jordan, Scott Callaghan, Ewa Deelman, Edward Field, Gideon Juve, Carl Kesselman, Philip Maechling, Gaurang Mehta, Kevin Milner, David Okaya, Patrick Small, Karan Vahi (2011), CyberShake: A Physics-Based Seismic Hazard Model for Southern California, Pure Appl. Geophysics, 168, 367-381, DOI: 10.1007/s00024-010-0161-6.
Julian C. Lozos (2016), A case for historical joint rupture of the San Andreas and San Jacinto faults, Science Advances, 2, doi: 10.1126/sciadv.1500621.
Tom Parsons, K. M. Johnson, P. Bird, J.M. Bormann, T.E. Dawson, E.H. Field, W.C. Hammond, T.A. Herring, R. McCarey, Z.-K. Shen, W.R. Thatcher, R.J. Weldon II, and Y. Zeng, Appendix C—Deformation models for UCERF3, USGS Open-File Rep. 2013–1165, 66 pp.
Seok Goo Song, Gregory C. Beroza and Paul Segall (2008), A Unified Source Model for the 1906 San Francisco Earthquake, Bull. Seismol. Soc. Amer., 98, 823-831, doi: 10.1785/0120060402
Kerry E. Sieh (1978), Slip along the San Andreas fault associated with the great 1857 earthquake, Bull. Seismol. Soc. Am., 68, 1421-1448.
Ross S. Stein, Aykut A. Barka, and James H. Dieterich (1997), Progressive failure on the North Anatolian fault since 1939 by earthquake stress triggering, Geophys. J. Int., 128, 594-604, 1997, 10.1111/j.1365-246X.1997.tb05321.x
Seismic Bracing Requirements for Nonstructural Components
Have you ever been at home during an earthquake and the lights turned off due to a loss of power? Imagine what it would be like to be in a hospital on an operating table during an earthquake or for a ceiling to fall on you while you are lying on your hospital bed.

