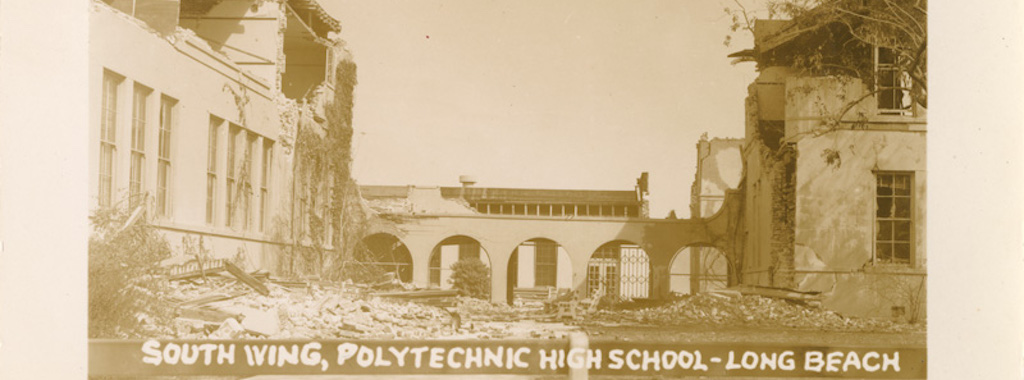
90 Years Later — How the Long Beach Earthquake Changed California’s Approach to School Construction

On March 10, 1933, around dinnertime, a magnitude 6.4 (Mw) earthquake struck the Long Beach area of California just before 6 p.m., causing widespread damage and resulting in 120 fatalities. This earthquake became a turning point in the way that earthquakes and their impacts were understood and addressed in the western US.

Continue Reading

Project Snapshot Series Part 2: Historic Theatre Retrofit Using FRP

Structural renovation work continues on an historic, 1920s-era theater in Hollywood, California. This major renovation will improve the structural performance of the building and help ensure that theatergoers and building occupants are safe in the event of a major earthquake. We are excited to share a second update on this project that focuses on the use of fiber-reinforced polymer (FRP) for strengthening the theater’s roof diaphragm.  Continue Reading

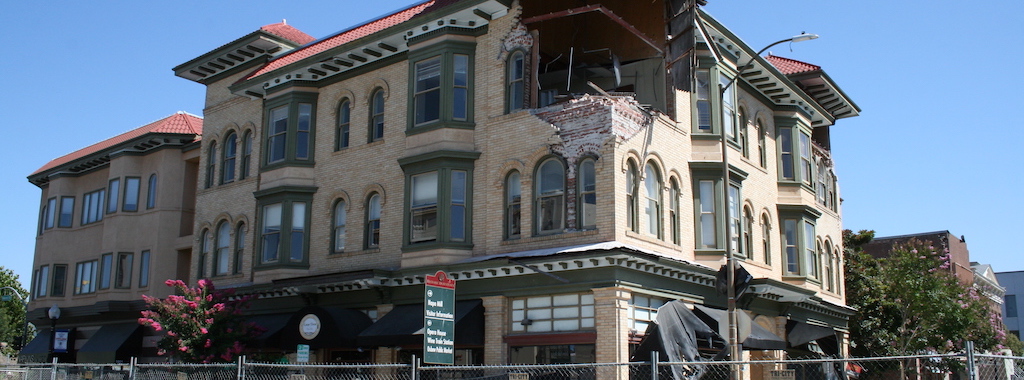
The Legacy of Loma Prieta

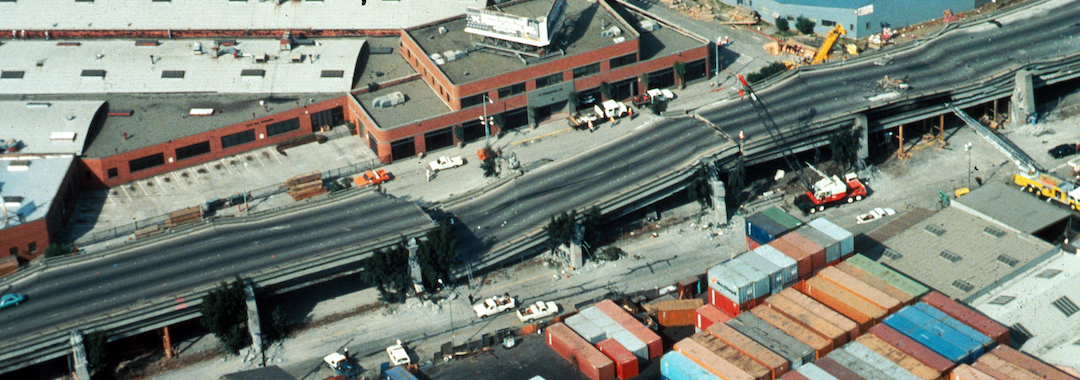
Every year on October 17, we take a moment to reflect on the 1989 Loma Prieta earthquake. The 6.9-magnitude earthquake was one of the most powerful and costly quakes to shake the San Francisco Bay area since the 7.9-magnitude earthquake of 1906. The quake caused an estimated $6 billion in damage and, tragically, resulted in 63 deaths and 3,757 injuries.

Many of those casualties were due to failing infrastructure when sections of the Nimitz Freeway collapsed.

Simpson Strong-Tie was founded in Oakland, California — practically in the heart of the Bay Area. Earthquakes were never far from the minds of our founders. It’s why even before Loma Prieta our mission was to provide solutions that help people design and build safer, stronger structures. However, it’s safe to say the earthquake not only reinvigorated our mission but inspired countless structural engineers who would go on to define the next 30 years of Simpson Strong-Tie research and development into community resilience.

Continue Reading

Build Change: My Favorite Child

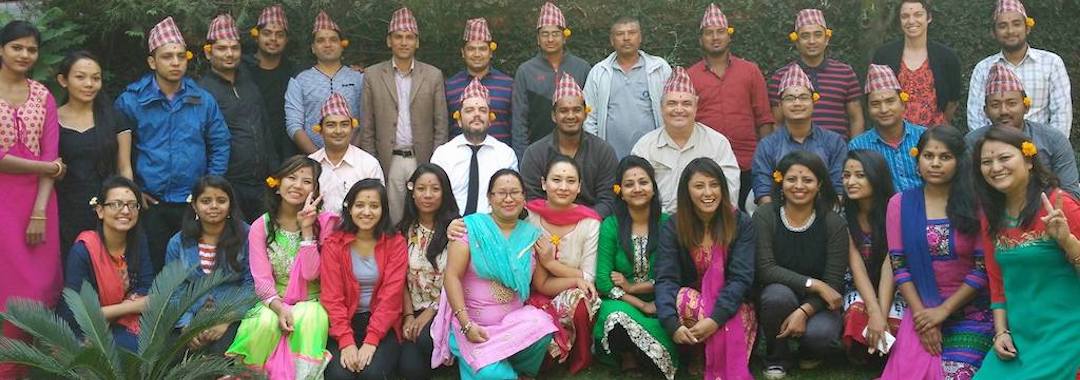
With the growing danger of natural disasters, the race is on to expand access to programs that safeguard lives from the human-made danger of poorly built housing. With the common mission of building safer, stronger structures, Build Change and Simpson Strong-Tie have partnered for the Simpson Strong-Tie® Fellowship for Engineering Excellence program. This year’s fellow is Build Change Engineering & Design Services Director Tim Hart, SE. As with our previous fellows, Hart is documenting his journey with the program on the Simpson Strong-Tie Structural Engineering blog. This is his final report.

In 2017, when I was in Nepal working for Build Change, I had a conversation with one of my colleagues about the volunteer work that I had done for the organization over the years. After telling him that I had worked with seven different country programs for Build Change, he asked me which of those countries I liked the best. My first thought was that it was like asking a parent which child he or she liked the best; even if I did have a favorite, I didn’t want to say it out loud for fear of offending my colleagues and friends in all the other countries. I said this to him to deflect the conversation and we went on to discuss other topics. Truth be told, while I enjoyed the culture and hospitality of all my Build Change host countries and believe in the value of the work I’ve done for them , I have a special soft spot for two of them: Indonesia and Nepal.

Continue Reading

Business Owners Today: What Else Could Happen?

How can a “Back-to-Business” plan help communities and business owners recover after a damaging event? In this guest blog post, David Cocke, S.E., explores the history of “B2B” programs and how they help expedite the inspection process so owners can get back to normal faster.

Business leaders have a lot to think about nowadays. With the current pandemic crisis, we have to consider health (ourselves, our families and our staff), liabilities, cash flow, workload, client retention and the pipeline for future work. Knock on wood that we don’t have to deal with any kind of natural disaster on top of this current situation, but more on that topic later…
Continue Reading

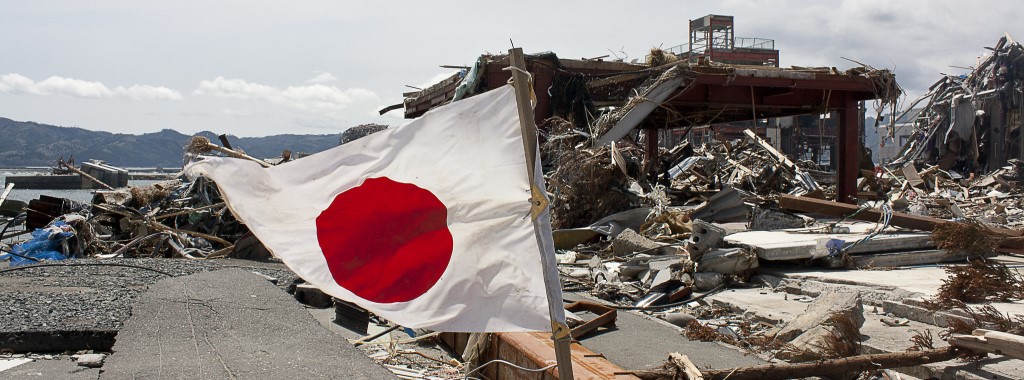
Dr. Lucy Jones: Mitigation Creates Community Resilience

A Shinto shrine in the Japanese coastal town of Minamisanriku has been the center of its community for centuries. In 1960, a tsunami generated by the great Chilean M9.5 earthquake swept into the ocean bay and damaged the shrine. The priest’s house situated at a higher elevation than the shrine had been spared any damage. The community came together and not only repaired the shrine but moved it up the hill, 50 feet above its previous location, to protect it from future events. 

Continue Reading

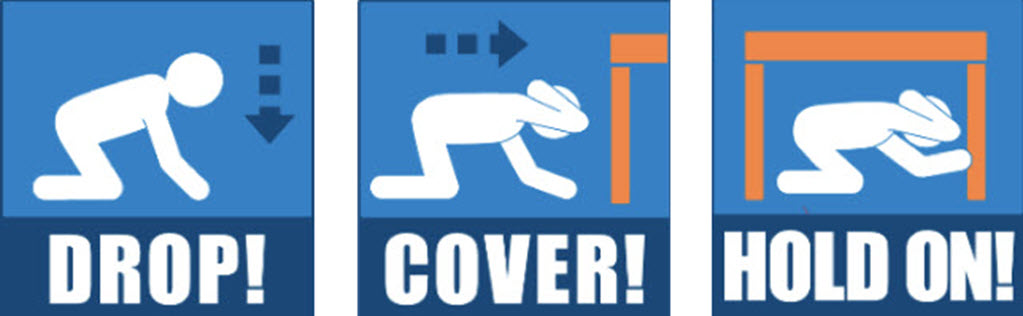
Drop, Cover, and Hold On – Becoming Earthquake-Smart in the 2017 Great ShakeOut

This week’s post was written by Jacob McAuley, Associate Regional Marketing Manager at Simpson Strong-Tie.

Every October, millions of people across the globe participate in earthquake drills as part of an event called the Great ShakeOut in order to improve their earthquake preparedness. This year, the Great ShakeOut took place on October 19 and involved more than 60 countries. In addition to the earthquake drill, participants in the event often take part in other activities such as seminars, Q&As and more. At Simpson Strong-Tie, we practiced earthquake drills at each of our major branches, and, in our Pacific Northwest region, we were part of a Reddit Ask Me Anything event (an online live Q&A) to talk about earthquake safety and answer people’s questions. Below, I discuss our participation in both of these activities.
Continue Reading

5 Steps to a Successful Soft-Story Retrofit

Last year, I gave a presentation at the annual National Council of Structural Engineers Associations (NCSEA) Summit in Orlando, Florida, titled “Becoming a Trusted Advisor: Communication and Selling Skills for Structural Engineers.” As this was a summit for the leaders of the structural engineers associations from across the country, I wasn’t sure how many people would find it valuable to spend their time learning about a very nontechnical topic. To my surprise and delight, the seminar ended up being standing-room only, and I was able to field some great questions from the audience about how they could improve their selling and communication skills. In the many conversations I had with the conference attendees after my presentation, the common theme was that engineers felt they needed more soft-skills training in order to better serve their clients. The problem, however, was finding the time to do so when faced with the daily grind of design work.

Structural Engineers In a Training for Seismic Retrofits
Presenting at the NCSEA Summit, I’m the tiny person in upper left hand corner.

When I started my first job as a design engineer at a structural engineering consulting firm straight out of school, I was very focused on improving and expanding my technical expertise. Whenever possible, I would attend building-code seminars, design reviews and new product solution presentations, all in an effort to learn more about structural engineering. What I found as I progressed through my career, however, was that no matter how much I learned or how hardworking I was, it didn’t really matter if I couldn’t successfully convey my knowledge or ideas to the person who really mattered most: the client.

Contractors discussing building plans with an engineer.

How can an engineer be most effective in explaining a proposed action or solution to a client? You have to be able to effectively sell your idea by understanding the needs of your client as well as any reasons for hesitation. The importance of effective communication and persuasion is probably intuitive to anyone who’s been on the sales side of the business, but not something that occurs naturally to data-driven folks like engineers. As a result of recent legislation in California, however, structural engineers are starting to be inundated with questions from a group of folks who have suddenly found themselves responsible for seismically upgrading their properties: apartment building owners in San Francisco and Los Angeles.

Imagine for a moment that you are a building owner who has received a soft-story retrofit notice under the City of Los Angeles’ Ordinance 183893; you have zero knowledge of structural engineering or what this term “soft-story” even means. Who will be your trusted advisor to help you sort it out? The City of Los Angeles Department of Building and Safety (LADBS) has put together a helpful mandatory ordinance website that explains the programs and also offers an FAQ for building owners that lets them know the first step in the process: hire an engineer or architect licensed in the state of California to evaluate the building.

Simpson Strong-Tie Structural Engineer Annie Kao at a jobsite.
Checking out some soft story buildings in Los Angeles. The Los Angeles Times has a great map tool.

I’ve had the opportunity to be the first point of contact for a building owner after they received a mandatory notice, because it turns out some relatives own an apartment building with soft-story tuck-under parking. Panicked by the notice, they called me looking to understand why they were being forced to retrofit a building that “never had any problems in the past.” They were worried they would lose rent money due to tenants needing to relocate, worried about how to meet the requirements of the ordinance and, most importantly, worried about how much it was going to cost them. What they really wanted was a simple, straightforward answer to their questions, and I did my best to explain the necessity behind retrofitting these vulnerable buildings and give an estimated time frame and cost that I had learned from attending the first Los Angeles Retrofit Resource Fair in April 2016. With close to 18,000 buildings in the cities of San Francisco and Los Angeles alone that have been classified as “soft-story,” this equates to quite a number of building owners who will have similar questions and be searching for answers.

To help provide an additional resource, Simpson Strong-Tie will be hosting a webinar for building owners in the Los Angeles area who have received a mandatory soft-story retrofit notice. Jeff Ellis and I will be covering “5 Steps to a Successful Retrofit” and helping to set a clear project path for building owners. The five steps that Simpson Strong-Tie will be recommending are:

  1. Understanding the Seismic Retrofit Mandate
  2. Partnering with Design Professionals
  3. Submitting Building Plans with the Right Retrofit Product Solutions
  4. Communicating with Your Building Tenants
  5. Completing Your Soft-Story Retrofit

We encourage you to invite any clients or potential clients to attend this informative webinar, which will lay the foundation for great communication between the two of you. As part of the webinar, we will be asking the building owners for their comments, questions and feedback so we can better understand what information they need to make informed decisions, and we will be sure to share these with the structural engineering community in a future post. By working together to support better communication and understanding among all stakeholders in retrofit projects, we will be well on our way to creating stronger and more resilient communities!

For additional information or articles of interest, there are several resources available:

SEAOSC Safer Cities Survey Results: How Are We Building Strength and Transparency in Our Communities?

Back in January, employees at Simpson were given the opportunity to learn more about the 401K retirement and investment plan. The big takeaways from my training session were a) save as much as you can as early as you can in life and b) use asset allocation to diversify your portfolio and avoid too much risk. Now, I’m not a big risk taker in general, so I dutifully picked a good blend of stocks and bonds with a range of low to high risk. It seems like a pretty sound strategy and it made me think of all the other ways I tend to minimize risk in my life. When I head to a restaurant, for example, I almost instinctively look for the county health grade sign in the window. When my husband and I went to go buy a new family car a couple years ago, I remember searching the National Highway Traffic Safety Administration (NHTSA) website for crash test ratings. Even when I’m doing something as mundane as having a snack, I will invariably flip over the Twinkie package to see just how many grams of fat are lurking inside (almost 5 per serving!). For all the rankings and information available to the general public for restaurants, cars and snacks, there isn’t much, if any, information to help us know if we’re minimizing our risk for one of the most common activities we do almost every day: walking into a building.

Risk level knob positioned on medium position, white background and orange light. 3D illustration concept for business security management.


Now before you accuse me of being overly dramatic about such a trivial activity, here’s some food for thought: research has shown that Americans spend approximately 90% of their day inside a building. That’s over 21 hours a day! Have you ever once thought to yourself, “I wonder if this building is safe? Would this building be able to withstand an earthquake or high wind event?” Or how about even taking a step back and asking, “Are there any buildings that are already known to be potentially vulnerable or unsafe, and has my city done anything to identify them?” Unfortunately, that kind of information about a city’s building stock is not usually readily available, but some in the community, including structural engineers, are working to change that.

Los Angeles skyline on a partly cloudy day with a row of palm trees in the foreground.


The charge is being led in California, a.k.a. Earthquake Country, where structural engineers are teaming up with cities to help identify buildings with known seismic vulnerabilities and provide input on seismic retrofit ordinances. Structural engineers have learned quite a bit about how buildings behave through observing building performance after major earthquakes, and building codes have been revised to address issues accordingly. However, according to the US Green Building Council, “…the annual replacement rate of buildings (the percent of the total building stock newly constructed or majorly renovated each year) has historically been about 2%, and during the economic recession and subsequent years, it’s been much lower.” This means that there are a lot of older buildings out there that have not been built to current building codes and were not designed with modern engineering knowledge.

Several cities in California have enacted mandatory seismic retrofit ordinances that require the strengthening of some types of known vulnerable buildings, but no state or nation-wide program currently exists. The Structural Engineers Association of Southern California (SEAOSC) recently decided to launch a study of which jurisdictions in the southern California region have started to take the steps necessary to enact critical building ordinances. According to SEAOSC President Jeff Ellis, S.E., “In order to develop an effective strategy to improve the safety and resilience of our communities, it is critical to benchmark building performance policies currently in place. For southern California, this benchmarking includes recognizing which building types are most vulnerable to collapse in earthquakes, and understanding whether or not there are programs in place to decrease risk and improve recovery time.” These results were presented in SEAOSC’s Safer Cities Survey, in partnership with the Dr. Lucy Jones Center for Science and Society and sponsored by Simpson Strong-Tie.

safer-cities-ca

This groundbreaking report is the first comprehensive look at what critical policies have been implemented in the region of the United States with the highest risk of earthquake damage. According to the Los Angeles Times, the survey “found that most local governments in the region have done nothing to mandate retrofits of important building types known to be at risk, such as concrete and wooden apartment buildings.”

The Safer Cities Survey highlights how the high population density of the SoCal region coupled with the numerous earthquake faults and aging buildings is an issue that needs to be addressed by all jurisdictions as soon as possible. An excerpt from the survey covers in detail why this issue is so important:

No building code is retroactive; a building is as strong as the building code that was in place when the building was built. When an earthquake in one location exposes a weakness in a type of building, the code is changed to prevent further construction of buildings with that weakness, but it does not make those buildings in other locations disappear. For example, in Los Angeles, the strongest earthquake shaking has only been experienced in the northern parts of the San Fernando Valley in 1971 and 1994 (Jones, 2015). In San Bernardino, a city near the intersection of the two most active faults in southern California where some of the strongest shaking is expected, the last time strong shaking was experienced was in 1899. Most buildings in southern California have only experienced relatively low levels of shaking and many hidden (and not so hidden) vulnerabilities await discovery in the next earthquake.

 The prevalence of the older, seismically vulnerable buildings varies across southern California. Some new communities, incorporated in the last twenty years, may have no vulnerable buildings at all. Much of Los Angeles County and the central areas of the other counties may have very old buildings in their original downtown that could be very dangerous in an earthquake, surrounded by other seismically vulnerable buildings constructed in the building booms of the 1950s and 1960s. Building codes do have provisions to require upgrading of the building structure when a building undergoes a significant alteration or when the use of it changes significantly (e.g., a warehouse gets converted to office or living space). Seismic upgrades can require changes to the fundamental structure of the building. Significantly for a city, many buildings never undergo a change that would trigger an upgrade. Consequently, known vulnerable buildings exist in many cities, waiting to kill or injure citizens, pose risks to neighboring buildings, and increase recovery time when a nearby earthquake strikes.

1994-northridge

The survey also serves as a valuable reference in being able to identify and understand what the known vulnerable buildings types are:

  1. Unreinforced masonry buildings: brick or masonry block buildings with no internal steel reinforcement — susceptible to collapse
  2. Wood-frame buildings with raised foundations: single-family homes not properly anchored to the foundation and/or built with a crawl space under the first floor — possible collapse of crawl space cripple walls or sliding off foundation
  3. Tilt-up concrete buildings: concrete walls connected to a wood roof — possible roof-to-wall connection failures leading to roof collapse
  4. Non-ductile reinforced concrete buildings: concrete buildings with insufficient steel reinforcement — susceptible to cracking and damage
  5. Soft first-story buildings: buildings with large openings in the first floor walls, typically for a garage — susceptible to collapse of the first story
  6. Pre-1994 steel moment frame buildings: steel frame buildings built before the 1994 Northridge earthquake with connections — susceptible to cracking leading to potential collapse

1933-earthquake-shot

Along with the comprehensive list of potentially dangerous buildings, the survey also offers key recommendations on how cities can directly address these hazards and reduce potential risks due to earthquakes. As a good starting point, the survey recommends having “…an active or planned program to assess the building inventory to gauge the number and locations of potentially vulnerable buildings…is one of the first steps in developing appropriate and prioritized risk mitigation and resilience strategies.

Economic costs can be substantial for businesses whose buildings have been affected by an earthquake. After a major seismic event, a structure needs to be cleared by the building department as safe before it can be reoccupied, and it will generally receive a green (safe), yellow (moderately damaged) or red (dangerous) tag.  A typical yellow-tagged building could take up to two months to be inspected, repaired and then cleared, meaning an enormous absence of income for businesses. The survey offers a strategy for getting businesses up and running quickly after an earthquake, in order to minimize such losses. The Safer Cities Survey recommends that cities adopt a “Back-to-Business” or “Building Re-Occupancy” program, which would “create partnerships between private parties and the City to allow rapid review of buildings in concert with City safety assessments…Back-to-Business programs…[allow] private parties to activate pre-qualified assessment teams, who became familiar with specific buildings to shorten evaluation time [and] support city inspections.

oes-inspectors-program

Basically, a program like this would allow a property owner to work with a structural engineer before an earthquake occurs. This way, the engineer is familiar with the building’s layout and potential risks, and can plan for addressing any potential damage. Having a program like this in place can dramatically shorten the recovery time for a business, from two months down to perhaps two weeks. Several cities have already adopted these types of programs, including San Francisco and Glendale, and it showed up as a component of Los Angeles’ Resilience by Design report.

Ultimately, the survey found that only a handful of cities have adopted any retrofit ordinance, but many cities indicated they were interested in learning more about how they could get started on the process. As a result, SEAOSC has launched a Safer Cities Advisory Program, which offers expert technical advice for any city looking to enact building retrofit ordinances and programs. This collaboration will hopefully help increase the momentum of strengthening southern California so that it can rebound more quickly from the next “Big One.”

We all want to minimize the risk in our lives, so let’s support our local structural engineering associations and building departments in exploring and enacting seismic building ordinances that benefit the entire community.

For additional information or articles of interest, please visit:

Temblor Insights: Is the San Andreas “locked, loaded, and ready to go?”

Editor’s Note: This is a republished blog post with an introduction by Jeff Ellis.

This is definitely an attention-grabbing headline! At the National Earthquake Conference in Long Beach on May 4, 2016, Dr. Thomas Jordan of the Southern California Earthquake Center gave a talk which ended with a summary statement that the San Andreas Fault is “locked, loaded and ready to go.”

The LA Times and other publications have followed up with articles based on that statement. Temblor is a mobile-friendly web app recently developed to inform homeowners of the likelihood of seismic shaking and damage based on their location and home construction. The app’s creators also offer a blog that provides insights into earthquakes and have writtene a post titled “Is the San Andreas ‘locked, loaded, and ready to go’?” This blog post delves a bit deeper to ascertain whether the San Andreas may indeed be poised for the “next great quake” and is certainly a compelling read. Drop, cover and hold on!

Volkan and I presented and exhibited Temblor at the National Earthquake Conference in Long Beach last week. Prof. Thomas Jordan, USC University Professor, William M. Keck Foundation Chair in Geological Sciences, and Director of the Southern California Earthquake Center (SCEC), gave the keynote address. Tom has not only led SCEC through fifteen years of sustained growth and achievement, but he’s also launched countless initiatives critical to earthquake science, such as the Uniform California Earthquake Rupture Forecasts (UCERF), and the international Collaboratory for Scientific Earthquake Predictability (CSEP), a rigorous independent protocol for testing earthquake forecasts and prediction hypotheses.

In his speech, Tom argued that to understand the full range and likelihood of future earthquakes and their associated shaking, we must make thousands if not millions of 3D simulations. To do this we need to use theTom Jordan portrait next generation of super-computers—because the current generation is too slow! The shaking can be dramatically amplified in sedimentary basins and when seismic waves bounce off deep layers, features absent or muted in current methods. This matters, because these probabilistic hazard assessments form the basis for building construction codes, mandatory retrofit ordinances, and quake insurance premiums. The recent Uniform California Earthquake Rupture Forecast Ver. 3 (Field et al., 2014) makes some strides in this direction. And coming on strong are earthquake simulators such as RSQsim (Dieterich and Richards-Dinger, 2010) that generate thousands of ruptures from a set of physical laws rather than assumed slip and rupture propagation. Equally important are CyberShake models (Graves et al., 2011) of individual scenario earthquakes with realistic basins and layers.

But what really caught the attention of the mediaand the public—was just one slide

Tom closed by making the argument that the San Andreas is, in his words, “locked, loaded, and ready to go.” That got our attention. And he made this case by showing one slide. Here it is, photographed by the LA Times and included in a Times article by Rong-Gong Lin II that quickly went viral.

Source: http://www.latimes.com/local/lanow/la-me-ln-san-andreas-fault-earthquake-20160504-story.html

Believe it or not, Tom was not suggesting there is a gun pointed at our heads. ’Locked’ in seismic parlance means a fault is not freely slipping; ‘loaded’ means that sufficient stress has been reached to overcome the friction that keeps it locked. Tom argued that the San Andreas system accommodates 50 mm/yr (2 in/yr) of plate motion, and so with about 5 m (16 ft) of average slip in great quakes, the fault should produce about one such event a century. Despite that, the time since the last great quake (“open intervals” in the slide) along the 1,000 km-long (600 mi) fault are all longer, and one is three times longer. This is what he means by “ready to go.” Of course, a Mw=7.7 San Andreas event did strike a little over a century ago in 1906, but Tom seemed to be arguing that we should get one quake per century along every section, or at least on the San Andreas.

Could it be this simple?

Now, if things were so obvious, we wouldn’t need supercomputers to forecast quakes. In a sense, Tom’s wake-up call contradicted—or at least short-circuited—the case he so eloquently made in the body of his talk for building a vast inventory of plausible quakes in order to divine the future. But putting that aside, is he right about the San Andreas being ready to go?

Because many misaligned, discontinuous, and bent faults accommodate the broad North America-Pacific plate boundary, the slip rate of the San Andreas is generally about half of the plate rate. Where the San Andreas is isolated and parallel to the plate motion, its slip rate is about 2/3 the plate rate, or 34 mm/yr, but where there are nearby parallel faults, such as the Hayward fault in the Bay Area or the San Jacinto in SoCal, its rate drops to about 1/3 the plate rate, or 17 mm/yr. This means that the time needed to store enough stress to trigger the next quake should not—and perhaps cannot—be uniform. So, here’s how things look to me:

The San Andreas (blue) is only the most prominent element of the 350 km (200 mi) wide plate boundary. Because ruptures do not repeat—either in their slip or their inter-event time—it’s essential to emphasize that these assessments are crude. Further, the uncertainties shown here reflect only the variation in slip rate along the fault. The rates are from Parsons et al. (2014), the 1857 and 1906 average slip are from Sieh (1978) and Song et al. (2008) respectively. The 1812 slip is a model by Lozos (2016), and the 1690 slip is simply a default estimate.

So, how about ‘locked, generally loaded, with some sections perhaps ready to go’

When I repeat Tom’s assessment in the accompanying map and table, I get a more nuanced answer. Even though the time since the last great quake along the southernmost San Andreas is longest, the slip rate there is lowest, and so this section may or may not have accumulated sufficient stress to rupture. And if it were ready to go, why didn’t it rupture in 2010, when the surface waves of the Mw=7.2 El Major-Cucapah quake just across the Mexican border enveloped and jostled that section? The strongest case can be made for a large quakeNicolas Ambraseysoverlapping the site of the Great 1857 Mw=7.8 Ft. Teton quake, largely because of the uniformly high San Andreas slip rate there. But this section undergoes a 40° bend (near the ‘1857’ in the map), which means that the stresses cannot be everywhere optimally aligned for failure: it is “locked” not just by friction but by geometry.

A reality check from Turkey

Sometimes simplicity is a tantalizing mirage, so it’s useful to look at the San Andreas’ twin sister in Turkey: the North Anatolian fault. Both right-lateral faults have about the same slip rate, length, straightness, and range of quake sizes; they both even have a creeping section near their midpoint. But the masterful work of Nicolas Ambraseys, who devoured contemporary historical accounts along the spice and trade routes of Anatolia to glean the record of great quakes (Nick could read 14 languages!) affords us a much longer look than we have of the San Andreas.

The idea that the duration of the open interval can foretell what will happen next loses its luster on the North Anatolian fault because it’s inter-event times, as well as the quake sizes and locations, are so variable. If this 50% variability applied to the San Andreas, no sections could be fairly described as ‘overdue’ today. Tom did not use this term, but others have. We should, then, reserve ‘overdue’ for an open interval more than twice the expected inter-event time.

This figure of North Anatolian fault quakes is from Stein et al. (1997), updated for the 1999 Mw=7.6 Izmit quake, with the white arrows giving the direction of cascading quakes. Even though 1939-1999 saw nearly the entire 1,000 km long fault rupture in a largely western falling-domino sequence, the earlier record is quite different. When we examined the inter-event times (the time between quakes at each point along the fault), we found it to be 450±220 years. Not only was the variation great—50% of the time between quakes—but the propagation direction was also variable.

However, another San Andreas look-alike, the Alpine Fault in New Zealand, has a record of more regular earthquakes, with an inter-event variability of 33% for the past 24 prehistoric quakes (Berryman et al., 2012). But the Alpine fault is straighter and more isolated than the San Andreas and North Anatolian faults, and so earthquakes on adjacent faults do not add or subtract stress from it. And even though the 31 mm/yr slip rate on the southern Alpine Fault is similar to the San Andreas, the mean inter-event time on the Alpine is longer than any of the San Andreas’ open intervals: 330 years. So, while it’s fascinating that there is a ‘metronome fault’ out there, the Alpine is probably not a good guidepost for the San Andreas.

If Tom’s slide is too simple, and mine is too equivocal, what’s the right answer?

I believe the best available answer is furnished by the latest California rupture model, UCERF3. Rather than looking only at the four San Andreas events, the team created hundreds of thousands of physically plausible ruptures on all 2,000 or so known faults. They found that the mean time between Mw≥7.7 shocks in California is about 106 years (they report an annual frequency of 9.4 x 10^-3 in Table 13 of Field et al., 2014; Mw=7.7 is about the size of the 1906 quake; 1857 was probably a Mw=7.8, and 1812 was probably Mw=7.5). In fact, this 106-year interval might even be the origin of Tom’s ‘once per century’ expectation since he is a UCERF3 author.

But these large events need not strike on the San Andreas, let alone on specific San Andreas sections, and there are a dozen faults capable of firing off quakes of this size in the state. While the probability is higher on the San Andreas than off, in 1872 we had a Mw=7.5-7.7 on the Owen’s Valley fault (Beanland and Clark, 1994). In the 200 years of historic records, the state has experienced up to three Mw≥7.7 events, in southern (1857) and eastern (1872), and northern (1906) California. This rate is consistent with, or perhaps even a little higher than, the long-term model average.

So, what’s the message

While the southern San Andreas is a likely candidate for the next great quake, ‘overdue’ would be over-reach, and there are many other fault sections that could rupture. But since the mean time between Mw≥7.7 California shocks is about 106 years, and we are 110 years downstream from the last one, we should all be prepared—even if we cannot be forewarned.

Ross Stein (ross@temblor.net), Temblor

You can check your home’s seismic risk at Temblor

References cited:

Sarah Beanland and Malcolm M. Clark (1994), The Owens Valley fault zone, eastern California, and surface faulting associated with the 1872 earthquake, U.S. Geol. Surv. Bulletin 1982, 29 p.

Kelvin R. Berryman, Ursula A. Cochran, Kate J. Clark, Glenn P. Biasi, Robert M. Langridge, Pilar Villamor (2012), Major Earthquakes Occur Regularly on an Isolated Plate Boundary Fault, Science, 336, 1690-1693, DOI: 10.1126/science.1218959

James H. Dietrich and Keith Richards-Dinger (2010), Earthquake recurrence in simulated fault systems, Pure Appl. Geophysics, 167, 1087-1104, DOI: 10.1007/s00024-010-0094-0.

Edward H. (Ned) Field, R. J. Arrowsmith, G. P. Biasi, P. Bird, T. E. Dawson, K. R., Felzer, D. D. Jackson, J. M. Johnson, T. H. Jordan, C. Madden, et al.(2014). Uniform California earthquake rupture forecast, version 3 (UCERF3)—The time-independent model, Bull. Seismol. Soc. Am. 104, 1122–1180, doi: 10.1785/0120130164.

Robert Graves, Thomas H. Jordan, Scott Callaghan, Ewa Deelman, Edward Field, Gideon Juve, Carl Kesselman, Philip Maechling, Gaurang Mehta, Kevin Milner, David Okaya, Patrick Small, Karan Vahi (2011), CyberShake: A Physics-Based Seismic Hazard Model for Southern California, Pure Appl. Geophysics, 168, 367-381, DOI: 10.1007/s00024-010-0161-6.

Julian C. Lozos (2016), A case for historical joint rupture of the San Andreas and San Jacinto faults, Science Advances, 2, doi: 10.1126/sciadv.1500621.

Tom Parsons, K. M. Johnson, P. Bird, J.M. Bormann, T.E. Dawson, E.H. Field, W.C. Hammond, T.A. Herring, R. McCarey, Z.-K. Shen, W.R. Thatcher, R.J. Weldon II, and Y. Zeng, Appendix C—Deformation models for UCERF3, USGS Open-File Rep. 2013–1165, 66 pp.

Seok Goo Song, Gregory C. Beroza and Paul Segall (2008), A Unified Source Model for the 1906 San Francisco Earthquake, Bull. Seismol. Soc. Amer., 98, 823-831, doi: 10.1785/0120060402

Kerry E. Sieh (1978), Slip along the San Andreas fault associated with the great 1857 earthquake, Bull. Seismol. Soc. Am., 68, 1421-1448.

Ross S. Stein, Aykut A. Barka, and James H. Dieterich (1997), Progressive failure on the North Anatolian fault since 1939 by earthquake stress triggering, Geophys. J. Int., 128, 594-604, 1997, 10.1111/j.1365-246X.1997.tb05321.x