Wood Shear Wall Design Example

Two weeks ago, I had the chance to present to the Young Members Group of the Structural Engineering Association of Metro Washington on the topic of Multi-Story Light-Frame Shear Wall Design. With all of the large firms in the D.C. area, it wasn’t a big surprise to find out that only about one-third of the group had experience with light-frame shear wall design.

However, while researching civil/structural engineering programs in the Midwest and Northeast last week (for our Structural Engineering/Architecture Student Scholarship program), I was disappointed to find that only about a quarter of the top engineering programs offer a wood design course. So I thought it might be helpful to post a wood shear wall design example this week.

The example is fairly basic but includes an individual full-height and perforated shear wall analysis for the same condition. The design is based on wind loading and SPF framing, both common in the Midwest/Northeast, and is based on the provisions and terms listed in the 2008 Special Design Provisions for Wind and Seismic (SDPWS), available for free download here, along with the recently posted 2015 version.

Multi-Story Shear Wall Example: Wind Loads with SPF Framing

Given:SE blog 1

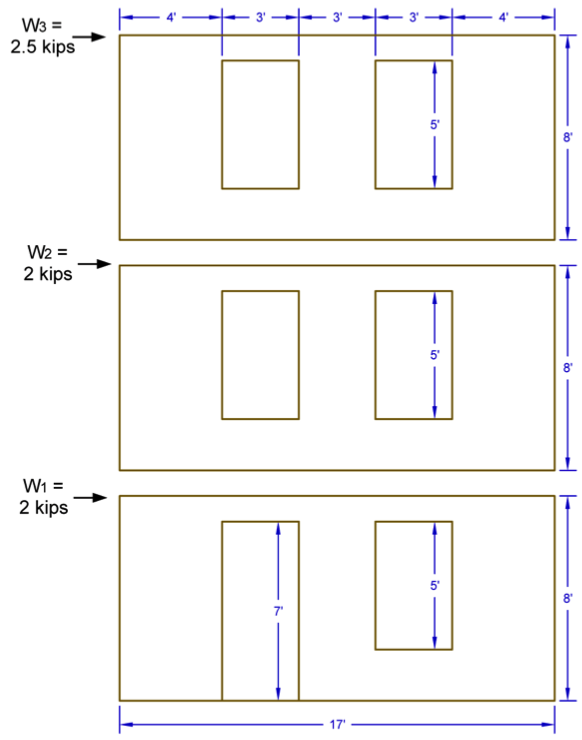
  • 2012 IBC & 2008 SDPWS
  • 3-Story Wood Framed Shear Wall Line
  • ASD Diaphragm Shear Forces from Wind as Shown
  • Wall and Opening Dimensions as Shown

Solution:

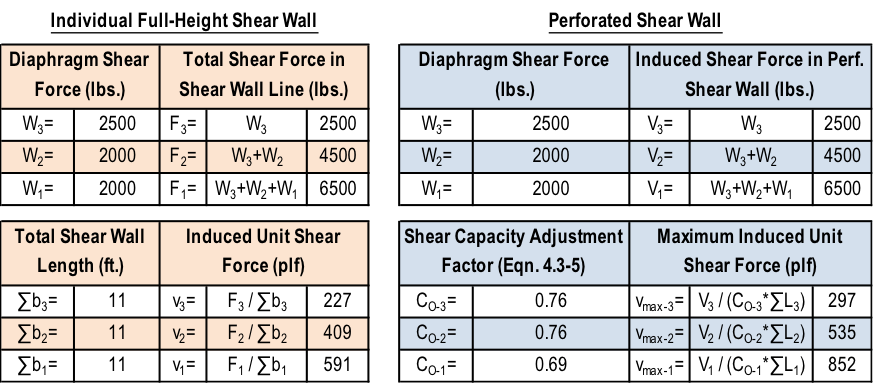
  1. Determine total shear force in each shear wall line.
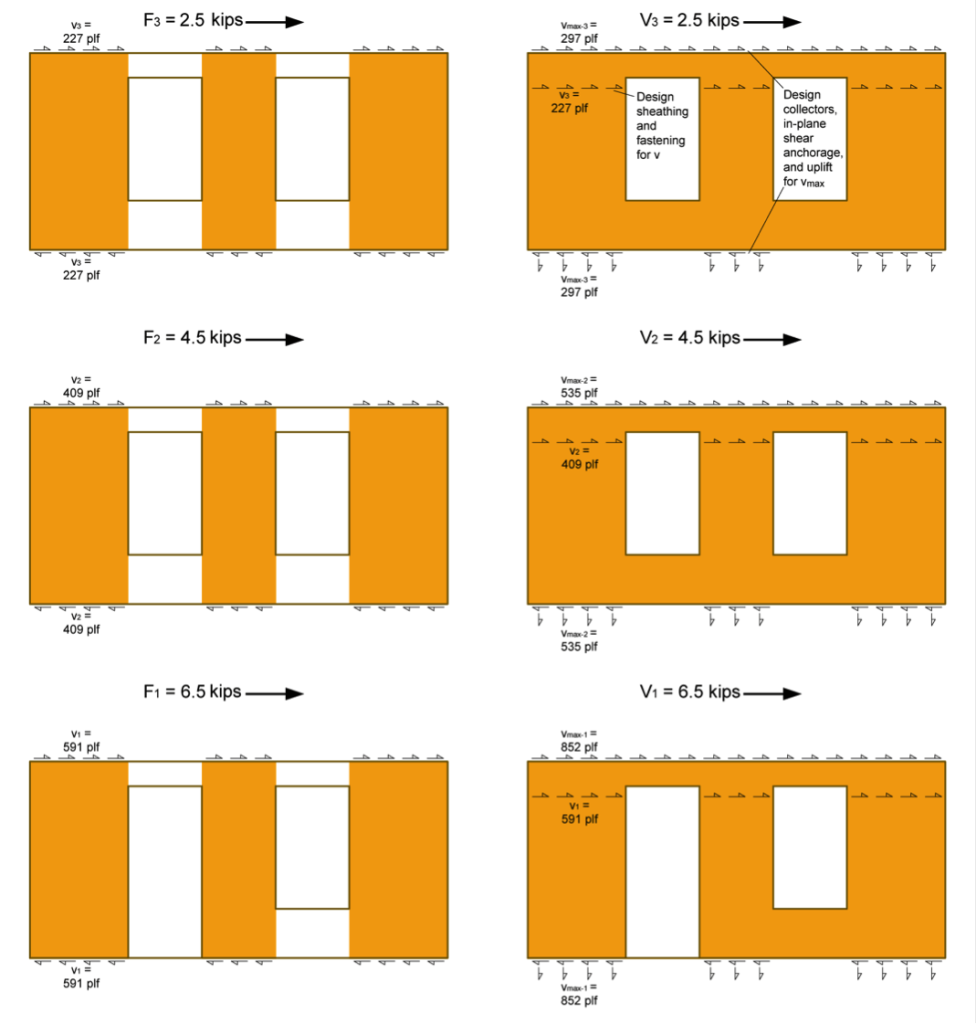
  2. Determine the Induced Unit Shear Force, v, for use with both shear wall types and the Maximum Induced Unit Shear Force, vmax, for the perforated shear wall collectors, shear transfer, and uniform uplift. Note the following:
    1. vmax requires the determination of the Shear Capacity Adjustment Factor, CO, for the perforated shear wall.
    2. The SDPWS provides two methods for determining CO, a tabulated value or a calculated value. This example uses the more precise calculated value.
    3. The perforated method requires the collectors be designed for vmax and the bottom plate to be anchored for a uniform uplift equal to vmax (as illustrated in the following figure).

SE blog 2

SE blog 4
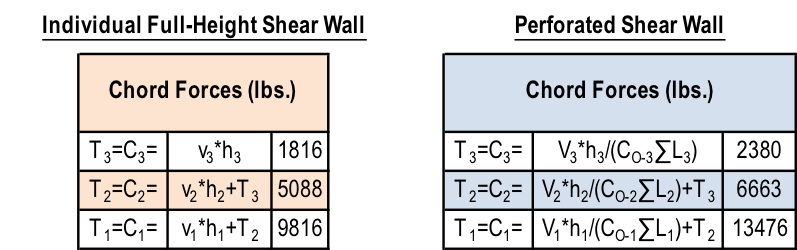
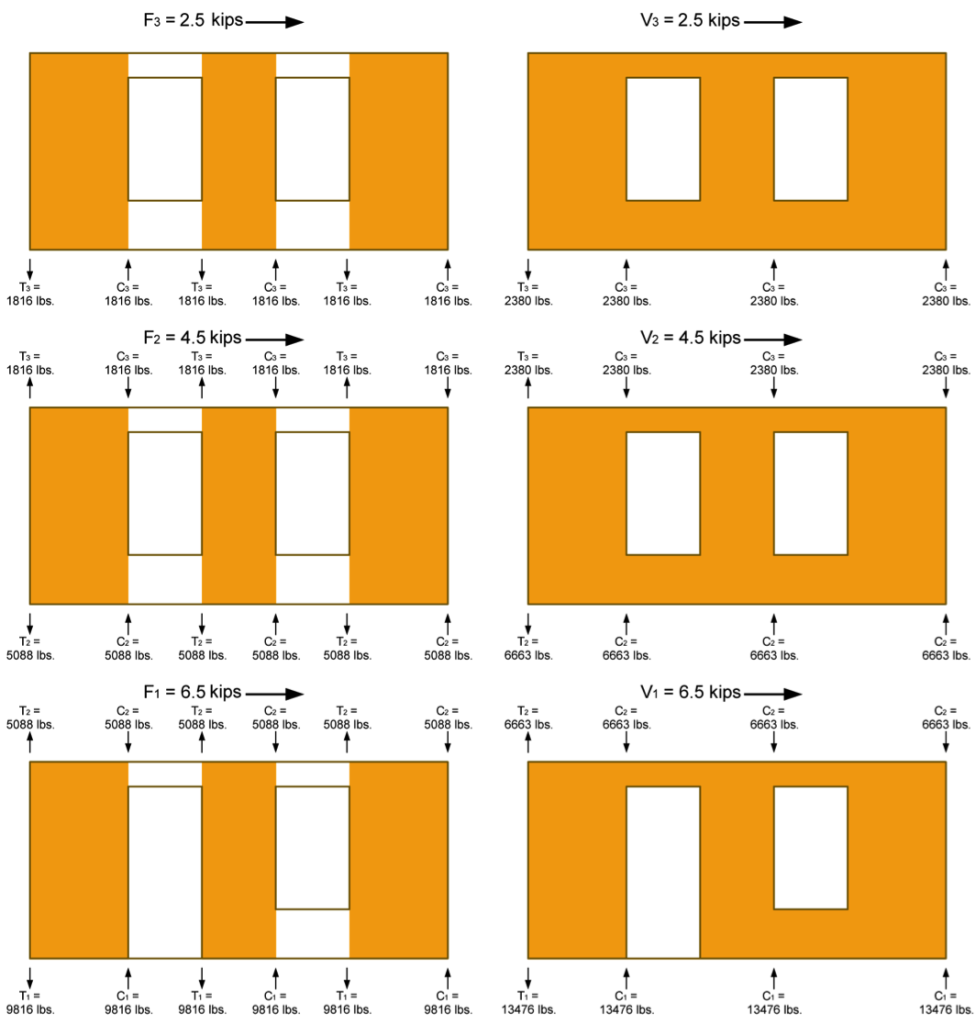
3. Determine the Tension, T, and Compression, C, forces in the chords (assume no contribution from dead load for this example). Note the following:

    1. Reverse wind loading will require a mirror image of the T & C forces shown in the following figure.
    2. The tension forces, T, shown in the example reflect the cumulative tension forces as they are transferred down from post-to-post, as is typical with traditional holdowns. For continuous rod systems like ATS, the incremental tension forces (resulting from the unit shear, vor vmax, at that level only) must also be determined as shown in the shear wall specification table at the end of this example.

SE blog 5

SE blog 5 SE blog 6
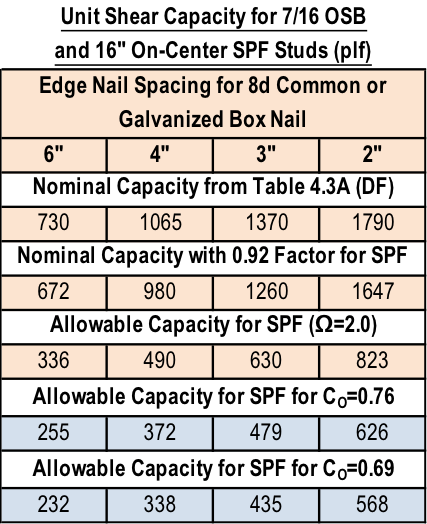
4. Determine sheathing material and fastening pattern based on v calculated in Step 2. The table below is based on 7/16″ wood structural panel sheathing values in SDPWS Table 4.3A.

SE blog 7

    1. Individual Full-Height Shear Wall:

i.     v3=227 plf: Use 7/16 OSB with a 6:12 nailing pattern which has an allowable load of 336 plf

ii.     v2=409 plf: Use 7/16 OSB with a 4:12 nailing pattern which has an allowable load of 490 plf

iii.     v1=591 plf: Use 7/16 OSB with a 3:12 nailing pattern which has an allowable load of 630 plf

B. Perforated Shear Wall (apply CO factor to allowable shear capacity):

i.     v3=227 plf: Use 7/16 OSB with a 6:12 nailing pattern which has an allowable load of 255 plf

ii.     v2=409 plf: Use 7/16 OSB with a 3:12 nailing pattern which has an allowable load of 479 plf

iii.     v1=591 plf: Use 7/16 OSB on both sides of the wall with a 4:12 nailing pattern which has an allowable load of 338*2=676 plf

5. Size the posts for compression. Simpson provides some useful tables in the back of the connector catalog with allowable tension and compression loads for a variety of sizes, heights, and species of posts.

6. Select holdowns for the tensions loads and verify post sizes are sufficient. For higher aspect ratio shear walls, the post size and holdown type may significantly reduce the moment arm between center of tension and center of compression, resulting in higher tension and compression forces.

The tables below show the shear wall specification for the walls in the example in a typical format. Note that they do not include some detailing that is required for items such as the uniform uplift force on the bottom plate of all perforated shear walls, or the perforated shear walls with OSB sheathing on both sides.

SE blog 8

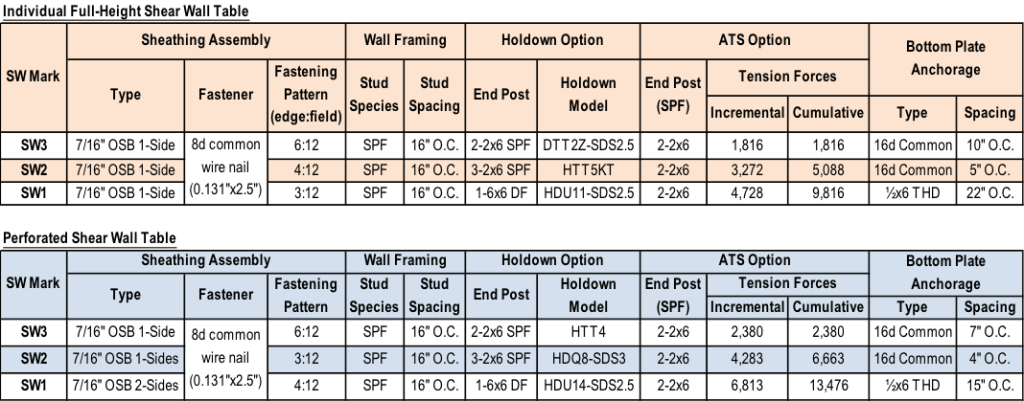
There are different ways to address the loads, so let us know if you would do anything differently in your designs.

Changes to 2012 IBC for Wind Design

The Greek philosopher Heraclitusis credited with saying “The only thing that is constant is change.”

If that applies to building codes, then it applies doubly to wind design using the 2012 International Building Code® (IBC).

The wind load requirements in Section 1609 of the IBC are based on ASCE 7 and refer to this document for most design information. In the 2012 IBC, the referenced version of ASCE 7 changed from the 2005 edition to the 2010 edition. In ASCE 7-10, the wind design requirements have been completely revised, including a complete design philosophy change.

SE blog 1

Wind design has changed from an allowable strength-based philosophy with a load factor of 1 in the ASD load combination to an ultimate strength design philosophy with a load factor of 1 in the strength design load combination. This means wind design has a similar basis as seismic design. So the new load combinations for wind look like this:

Strength Design: 0.9D + 1.0W
Allowable Stress Design: 0.6D + 0.6W

Because of the change in load factor and philosophy, the basic wind speed map had to be altered. In the past, one map was provided and the design return period was increased for certain occupancies by multiplying the load by an importance factor. In ASCE 7-10 there are three maps provided so now an importance factor is no longer needed. The return period of the map depends on the risk to human life, health and welfare that would result from the failure of that type of building. This was previously called the Occupancy Category, but it is now called the Risk Category.

Risk Category III and IV buildings use a basic wind speed map based on a 1,700-year return period. Risk Category II buildings use a basic wind speed map based on a 700-year return period. And Risk Category I buildings use a basic wind speed map based on a 300-year return period. Because of the higher return period, the mapped design wind speed will be much higher than when using previous maps. However, with the lower load factors, actual design loads will be the same or in many areas lower due to other changes in the way the map was developed.

wind map
Excerpted from the 2015 International Residential Code; Copyright 2014. Washington D.C.: International Code Council. Reproduced with permission. All rights reserved. www.iccsafe.org

SE blog 3

Another change to ASCE 7-10 for wind design is that Exposure D is no longer excluded from hurricane prone regions; so buildings exposed to large bodies of water in hurricane prone regions will have to be designed for Exposure D.

Because of the change in wind speeds, there is a change in the definitions of windborne debris regions. Due to the different wind speed design maps, the windborne debris region will be different depending on the Risk Category of the building being built. The windborne debris region is now defined as areas within hurricane-prone regions that are either within 1 mile of the coastal mean high water line where the ultimate design wind speed is 130 mph or greater; or any areas where the ultimate design wind speed is 140 mph or greater; or Hawaii. Risk Category II buildings and structures and Risk Category III buildings and structures (except health care facilities), use the 700-year Risk Category II map to define wind speeds for the purpose of determining windborne debris regions. Risk Category IV buildings and structures and Risk Category III health care facilities use the 1700-year return Category III/IV wind speed map to define wind speeds for the purpose of determining windborne debris regions.

Finally, a new simplified method for determining wind loading on ENCLOSED SIMPLE DIAPHRAGM BUILDINGS WITH h ≤ 160 ft has been added to ASCE 7-10. This is different from the simplified all heights method in the IBC, so it will be interesting to see which method becomes more widely used. Which method do you prefer? Let us know in the comments below.

Remembering Barclay Simpson

On Saturday evening, Barclay Simpson passed away peacefully in his sleep, surrounded by his family. He was 93 years old. With Barc’s passing, Simpson Strong-Tie has lost a beloved and inspirational leader. Our country has lost a generous philanthropist, visionary and great American entrepreneur. Those of us who were fortunate enough to know and work with Barc have lost a dear friend, champion and guide.

Barc’s contributions to the construction industry, non-profit community and our employees are immeasurable. He instilled the core values — our “Secret Sauce” — that have made Simpson Strong-Tie a unique and inspiring place to work and have built our reputation as a quality, trusted manufacturer and solid corporate citizen.

Barclay Simpson

The first time I met Barc was less than a week after I started working in the R&D department. I was meeting with a product manager and Barc was walking by, so he stopped in to say hello. We introduced ourselves and chatted for a few minutes. I told him about my work experience, where I went to school, what I was working on, and he even asked where I grew up. He was genuinely interested in getting to know me, which made me feel welcome.

I later noticed that Barc usually parked at the end of the building furthest from his office. He would take a different path through the building – sometimes through engineering, other times he would walk through marketing, accounting, or even the connector test lab. Barc cared deeply for all of his employees, and the intentionally long walk gave him the opportunity to talk with folks.

He firmly believed that everybody in the company is important, and he took every opportunity to remind us. In the video, Barclay Simpson’s Nine Principles of Doing Business, Barc speaks quite passionately about dignifying the contribution of every individual at every level.

In the end of a previous blog post, I mentioned Barc’s 1974 list of Rambling Thoughts on Making One’s Fleeting Moment on This Planet a Pleasant One. In the context of that post, the thoughts of “Attitude Conquers All” and “Keep it light. It really isn’t that important” were appropriate.

Thinking of Barc and his legacy, I prefer this rambling thought from his list:

Strive to have a POSITIVE EFFECT upon those lives touched by your own.

Innovative Screws Are Replacing Bolts

In the past several years, there has been an increase in the use of screws in applications that have traditionally been reserved for bolts and lag screws. Greater innovation in the wood screw market has caused this shift. Proprietary wood screws now offer many more benefits than commodity bolts and lag screws. Today, this post will discuss some of those benefits.

Continue Reading

Truss-to-Truss and Truss-to-Everything Else Connections

One of the questions I am asked most frequently is “Who is responsible for the truss-to-(fill in the blank) connection? One such example is the truss-to-wall connection. To answer this question, it helps to recognize there are two types of connections: a truss-to-truss connection and a “truss-to-everything-else-except-a-truss” connection. The Truss Designer is responsible for the former, and the Building Designer is responsible for the latter. Pretty simple, right?  So why all the questions?

Excerpt from ANSI/TPI 1-2007 Chapter 2 on Design Responsibilities

Some people incorrectly assume the Truss Designer is responsible for connecting the truss to everything the truss touches. Then, when the Truss Designer doesn’t specify a connection to something the truss touches (such as a wall), it prompts the question, “Hey, who is responsible for that connection? I thought the Truss Designer was!” In other cases, the person asking the question is actually challenging the answer, such as “Shouldn’t the Truss Designer be specifying the truss-to-wall connection? Why don’t they?” And finally, the question may be prompted at times when the project doesn’t have a Project Engineer (aka the Building Designer), so the question becomes, “Now who is going to specify that connection? It must be the Truss Designer, right?”

But the Truss Designer isn’t responsible for the truss-to-wall connection – and here’s why. Unless the scope of work has been expanded by contract, the Truss Designer is responsible for designing an individual component. The truss gets designed for a given set of specified loads, environmental conditions, serviceability criteria and support locations, all which are specified by the person responsible for the overall building: the Building Designer. Once designed, the truss will have a maximum download reaction and uplift reaction (if applicable) at each support location. Is that enough information to specify a truss-to-wall connection? No, it is not. First, the Truss Designer may not know what the truss is even sitting on; he or she may only know that the bearing is SPF material and 3 ½” wide. Is it a single top plate or double top plate? Is there a stud below the truss that can be connected to, or is the stud offset? Or, is the truss sitting on a header spanning across a wide window?

Sample Truss Reactions

Second, even if the Truss Designer had all of the information regarding the bearing conditions, there is another problem. The Truss Designer has the reactions resulting from the loads applied to the truss. What about the reaction at the top of the wall (perpendicular to the wall) resulting from the lateral loads applied to that wall? And the shear loads acting parallel to the wall as a result of lateral loads applied to the end wall? These loads also need to be resisted by the truss-to-wall connection (hence, the F1 and F2 allowable loads that are published for hurricane ties), so the Truss Designer cannot select an adequate truss-to-wall connection based on the truss reactions alone.

Truss-to-Top Plate and Truss-to-Stud Connections

Finally, there’s one more scenario to consider. Say a Building Department requires that truss-to-wall connections must be specified by the Truss Designer on projects that have no Engineer of Record. It wants to ensure trusses are adequately secured to the walls, and the Truss Designer may seem best equipped to determine those connections (this has actually happened in some places). The Truss Designer can find out what exactly the truss is sitting on, and can even calculate some approximate reactions for the top of the wall to conservatively take into account during the selection of the connection. Problem solved? Not entirely. That takes care of the top of the wall, but the load doesn’t stop there. So requiring the Truss Designer to specify the truss-to-wall connection only transfers the problem to the bottom of the wall. Who is going to address those connections?

Continuous Load Path

While most people don’t think of the Truss Designer as being the person responsible for the connections at the bottom of the wall, many do think the Truss Designer should be responsible for the connections at the top of the wall. But because someone – namely, the Building Designer – still needs to ensure that a continuous load path has been satisfied by the connections in the building, does it really help to increase the scope of work of the Truss Designer to specify the truss-to-wall connection?

Let us know your thoughts in the comments below.

The Importance of Resilient Communities During Earthquakes

Imagine that it’s 4:30 a.m. and suddenly you’re awakened by strong shaking in your home. Half asleep, you hang on to your bed hoping that the shaking will stop soon. All of a sudden, the floor gives away and you fall. You think, “What just happened? How could this have possibly occurred? Am I alive?”

These could have been the thoughts of Southern California residents living in one of the many apartment buildings, which collapsed on January 17, 1994, during a 6.7 magnitude earthquake. The Northridge Earthquake brought awareness to buildings in our communities with a structural weakness known as a soft story, a condition that exists where a lower level of a multi-story structure has 20% or less strength than the floor above it. This condition is prevalent in buildings with tuck-under parking and is found in multistory structures throughout San Francisco, Los Angeles and other cities (see Figure 1). These structures are highly susceptible to major damage or collapse during a large seismic event (see Figure 2).

Soft Story building
Figure 1: Multi-unit wood-frame building with first weak story.
Aftermath of an earthquake
Figure 2: Collapsed soft story tuck under parking building. Image courtesy of LA Times

Soft story retrofits help to strengthen our communities and make them more resilient to major disasters. There are several resources available to structural engineers that need to retrofit weak-story buildings. Some of these resources are mentioned in our September 18 blog post.

During the 2014 SEAOC Convention held in Indian Wells on September 10-13, speakers discussed different methods, analysis and research that address the behavior of various materials and construction types during seismic events along with approaches to retrofit historically poor performing structures. This information can be viewed from the convention’s proceedings available at www.seaoc.org.

On October 20, 2014, the Structural Engineers Association of Southern California (SEAOSC) will be hosting their 4th annual Strengthening Our Cities BAR Summit in downtown Los Angeles. This event brings together many different stakeholders in our built environment, including public officials, building owners and managers, business owners, insurance industry representatives, emergency managers and first responders, and design professionals.

Many prestigious thought leaders, including USGS Seismologist Dr. Lucy Jones will be speaking at the summit, discussing such topics as tools and analysis methods for retrofitting vulnerable buildings and the Building Occupancy Resumption Program (BORP).

Expect a great day full of useful information about ways to strengthen our communities and prepare for major earthquakes as well as opportunities to network with like-minded peers. For additional information and to register, visit www.barsummit.org. We also hope you’ll visit our booth. We look forward to speaking with you there.

Remembering Loma Prieta

We all know that earthquakes physically shape the landscape here in California, but they shape careers as well.  Earthquakes I felt while growing up in California’s southern San Joaquin Valley got me thinking about engineering as a career while in high school. When the Loma Prieta earthquake struck on October 17, 1989, like many of you I was watching the World Series live on television and thus got to see the earthquake live as well. I was in my senior year of college at the time, studying Civil Engineering with a structural emphasis. This earthquake cemented the direction I would take in my career. I wanted to be a structural engineer, and I wanted to design buildings that would not fall down in earthquakes.

Continue Reading

Fastener Catalog Breakdown: Technical Section LRFD Values

Structures and connections can be designed either using Allowable Strength Design (ASD) method or Load and Resistance Factor Design (LRFD) method. In the ASD method, the allowable strength is calculated by dividing the nominal strength by a safety factor. In the LRFD method, the design strength is calculated by multiplying the nominal strength by the resistance factor. In design, the adjusted ASD design value is compared to a calculated load or stress. As long as the adjusted ASD design value exceeds the calculated load of stress, then the ASD design value is judged safe. In LRFD design, the nominal strength is equated to factored loads. If the factored strength is greater than the factored loads, then the design can be accepted. ASD is the more common method adopted in the professional world.Continue Reading

Applying new FEMA P-807 Weak Story Tool to Soft-Story Retrofit

We have written about San Francisco’s Soft-Story Retrofit Ordinance and Soft-Story Retrofits before on the blog. I wanted to discuss in more detail the issues with soft story buildings and FEMA’s new tool for addressing them. Under the San Francisco Ordinance, wood-framed residential structures that have two or more stories over a “soft” or “weak” story require seismic retrofit. So far, more than 6,000 property owners have been notified about complying with the mandate.Continue Reading